TruVizion: Features for Fiber & Cable Networks
TruVizion’s patented technology provides your team with a host of valuable features not available in other diagnostics applications. Here are just a few.
Most tools that provide in-depth broadband network diagnostics information only support one type of broadband platform. If you have a Fiber network, a limited number of staff may have access an element management system with limited diagnostics at best, and which is not very user friendly. If you manage cable devices, you may have a diagnostics tool just for that. With TruVizion, you get detailed broadband diagnostics for troubleshooting Fiber to the Home (FTTH) and DOCSIS cable networks. TruVizion gives you a single diagnostics application with a common interface that lets you troubleshoot both types of networks and devices, further increasing the efficiency in your operation.
Organized and Intuitive Interface
We developed TruVizion to help multiple groups within your company make a difference in the quality of the service you provide. It can be used by your office staff, support technicians and engineers. Unlike other tools, you don’t have to search multiple screens to find what you’re looking for, and then realize you need an engineering degree to understand it all. The interface clearly shows what’s most relevant and most important, and it’s organized and presented in a way that makes troubleshooting your broadband modems and network a snap. The OLT and CMTS diagnostics screens provide a clear summary of issues and alerts and are perfect for your networking and engineering staff as they track down plant issues. The ONT and cable modem diagnostics screens are tailor made for your Call Center staff as they work with subscribers to troubleshoot issues.
Many diagnostic tools don’t get down to the customer level. TruVizion makes it easy to pull up an individual subscriber by modem or customer information. The search tools are always right there, wherever you are in the application. Quick Search allows you to find customers by last name, email address, phone number, or the MAC address of either the modem or any CPE device connected to the modem. One click opens the Full Search feature, where you can find customers by business name, physical address (like street name or zip code) or the IP address of either the modem or any device attached to the modem and other parameters. Plus, in all of the drill-in reports in TruVizion you can see the customer name and address and one click will take you to that customer’s device.

View this video to see modem summary features in TruVizion.
The CPE Diagnostics screen will help your support reps quickly find and resolve problems for individual customers, as well as see issues that may be impacting multiple subscribers. Current readings like RF levels, bandwidth use, alarms, errors, and other key metrics for that device are shown on a single, easy-to-read screen along with a map of the customer’s location. If the subscriber is on a cable modem, we also show key readings from the upstream channel the customer’s connected to. Your reps can easily ping the CPE or attached devices, view modem logs or reset the ONT or cable modem with a click of the mouse.
Are you a history buff? In addition to real-time ONT Diagnostics screens and RF data on the Cable Modem, one click will open a page of interactive charts that show the same metrics over the last 24 hours. Want to drill further into the past? One click more and you can view the last 7 days, 30 days or 90 days. What about the here and now? On Cable Modems, where signal levels are much more intermittent, you can also select “Live” to watch readings as they stream in every five seconds, which is really helpful when you’re trying to figure out if you’ve fixed the issue (or made it worse).
Ever wonder how many of your cable modems were already misbehaving right after installation? You can run a Post-install Report at any time to see those modems that were out-of-spec the day they were installed, including a snapshot of the total flaps, codeword errors and the RF levels at that time.
50% or more of the complaints subscribers have about slow broadband service are actually related to their home WiFi network. TruVizion collects statistics from compatible cable modems that have an embedded Access Point and presents the information on a WiFi Diagnostics screen. Technicians can see the channel the radio is tuned, its performance, and the transmit and receive levels for each connected device. You can drill-in to plot this data over the last 24 hours, 7 days, 30 days or 90 days. You can also click to stream the data live as a customer changes the location of their device or the location or orientation of the access point. For compatible GPON devices we can link your service rep right to the device in the home so they can remotely manage the ONT just as if they were in the home connected to the ONT’s GUI.
These WiFi features help your staff determine if a problem is related to the subscriber’s broadband connection or their in-home network. And, it can eliminate the need to roll a truck; or, for a Call Center representative it can eliminate the need to walk the subscriber through the process of accessing the device’s management GUI in order to access troubleshooting data or changing settings, which is not very efficient. The support rep can handle common requests that normally would take a lot of time if they have to guide the user through the steps, such as setting up or managing port forwarding, helping set up parental controls, changing a password or SSID name, etc.
If you’re offering VoIP service, you know how difficult it is to troubleshoot voice-quality issues. TruVizion allows your staff to see and resolve common issues affecting VoIP customers. For cable modems we have a VoIP diagnostics screen where you can view the hook status, battery state/charge and the MOS scores for the last ten calls. You can also drill-in for additional RF stats on the last 10 calls, or run a Loop Diagnostics test to check the customer’s inside wiring. For ONTs we present data on hook status, outbound and inbound call attempts and completions, and more.
For cable networks you can also download a daily report to help you proactively improve your VoIP service. The report lists all calls that had one or more bad MOS scores, which would indicate an issue with call quality. In addition to the MOS scores from the call, the report shows the SNR, packet loss and delay at the time of the call to help with troubleshooting the reason for the poor call quality. Finally, the report also lists any devices that have a battery issue or that had a problem communicating with the CMTS.
If you have deployed DOCSIS 3.1 in your cable plant, TruVizion has an OFDM module that will show information about the subcarriers, such as power levels and average receive MER across your OFDM channels, codewords on the PLC, and other helpful information.
Full Band Spectrum Capture
For DOCSIS networks, TruVizion has a spectrum module that can display the spectrum for all data and video channels passing through a cable modem or set-top box that supports full band capture. It’s like having a meter on your desk or mobile device connected remotely to the modem at the subscriber location. If a device supports full band capture, a clickable tab will bring up live downstream spectrum information. There is also a report in TruVizion that shows you all devices that support spectrum capture.
It’s nice to see what’s been happening with a subscriber’s cable modem over time. Even nicer is to compare that modem’s readings with other nearby modems.
One click in TruVizion overlays the data in the charts with readings from the five geographically closest modems so you can see if others are having similar problems. Yes, you know your plant better than we do. If you don’t like one or more of the modems we picked to compare, you can easily choose any other four modems from the 25 closest to that customer.
Often times a map in a diagnostics application is eye candy. It’s kind of colorful and cool-looking, but it’s just not that useful. In TruVizion the maps not only look sweet, they are sweet. Your staff can actually use them to quickly find and diagnose customer-affecting issues. Sure, they’re colorful. Green is good, and you’ll immediately see those devices that are performing within spec. Yellow tells you a device is marginal, and red says something’s really wrong. Best of all, you can filter the map by status or alerts. With a click you can see only devices that are off-line (really helpful when finding and fixing an outage). Another click will show only out-of-spec modems, or you can further filter to see only those modems that are having a specific RF issue. If you’re managing a cable plant, you can also filter the map pins by node and active leg. Want to know more about one of those pins? Click a pin to see the summary RF data for that modem and click again to pull up the full CPE Diagnostics screen for that subscriber.
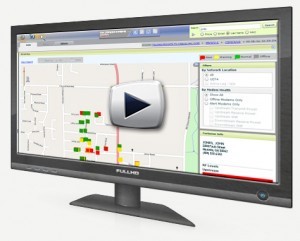
Watch this video to learn more about this feature!
Do you have customers that are not geocoded automatically, or are geocoded incorrectly? This is a problem for some providers depending on how up-to-date maps and addresses are kept in their area. Not a problem in TruVizion. You can easily geocode a device in our system or correct a location if it’s not right. You can add a pin or change the location of a pin on our map with a couple of clicks. If you are on a mobile device at the customer’s location it’s even easier. Just tap to geocode the device and place it on the map right where you are.
A powerful feature in TruVizion is the ability to view historical data for PON ports and ONTs and historical information about any upstream or downstream channel on cable networks. For Fiber networks click on a PON label to display charts showing historical ONT statistics (transmit and receive power, and any data video or voice errors), upstream and downstream bandwidth utilization on that PON port, temperature, errors (BIP, GEM and Burst), and status of the ONTs over time. For cable networks one click on a channel label will plot charts showing RF levels, upstream SNR, bandwidth utilization, modem status, and codeword errors over time. You can see the last 24 hours, 7 days, 30 days or 90 days.
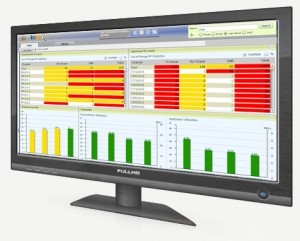
OLT and CMTS Diagnostics Screens
TruVizion’s OLT Diagnostics screen aggregates and displays information in a similar format with upstream and downstream levels from the connected ONTs, the status of each PON, upstream and downstream bandwidth utilization, online ONT status, and alarms on each port. The CMTS Diagnostics screen gives a summary view of the health of the CMTS on a single screen. Color-coded bars show the highest priority issues regarding RF levels, bandwidth utilization, SNR, modem status and codeword errors. In both platforms you can pinpoint trouble areas by drilling in to view a report on all devices experiencing similar issues. Reports can be saved or printed, and you can even map all of the devices shown on a report with a single click.
TruVizion is integrated with ZCorum’s provisioning system and can provision your CPE in real-time.
TruVizion can process alerts that let you know when certain issues or events occur, like a sudden increase in off-line devices or when a threshold is exceeded for a specific RF level.
TruVizion has several reports that will help you better manage your network and business. Here are some of the reports included in TruVizion:
- ONT Statistics Report — Run a report showing the status of each ONT connected to a specific OLT, Vendor and Model of the ONT, the port each is connected to, and any data, video or voice errors.
- ONT Performance Report — See each ONT with vendor, model and errors (BIP, GEM and Burst).
- DOCSIS Codeword Errors — Drill in to see a report of correctable and uncorrectable codeword errors.
- Post Install Reporting — Shows you the state of a cable modem the day it was installed, including flaps, codeword errors, and RF levels.
- EMTA Report — A great report for those providing VoIP service, it shows subscribers who likely had call quality issues during the date range selected. It includes the call’s time and duration, the MOS scores, and the key RF levels at the time of the call. The report will also alert you to any devices that need to have batteries serviced or replaced.
- Non-Geocoded Devices — You can run a report showing all cable modems and ONTs that are not geocoded in the system. TruVizion makes it easy to add pins to the map for any modems that are not geocoded, or to correct the location if a device was automatically geocoded incorrectly.
- Cable Modem Summary Report — A complete listing of all cable modems in the system, including manufacturer, model, firmware level, MAC Address and subscriber information.
- Bandwidth Reports — Run reports showing upstream and downstream bandwidth utilization for cable modems and ONTs over a selected date range.


 Try it for Yourself