


PreEqualization Analyzer: Features
DOCSIS PNM Data
PreEqualization Analyzer is a Proactive Network Maintenance (PNM) tool that lets you clearly see which devices are being impacted by upstream impairments like micro-reflections and group delay, the severity of the problem, and the approximate location of the fault that’s causing the issue. And, you can see the issue before service is ever impacted for the subscriber. That lets you proactively fix the problem as part of your routine.
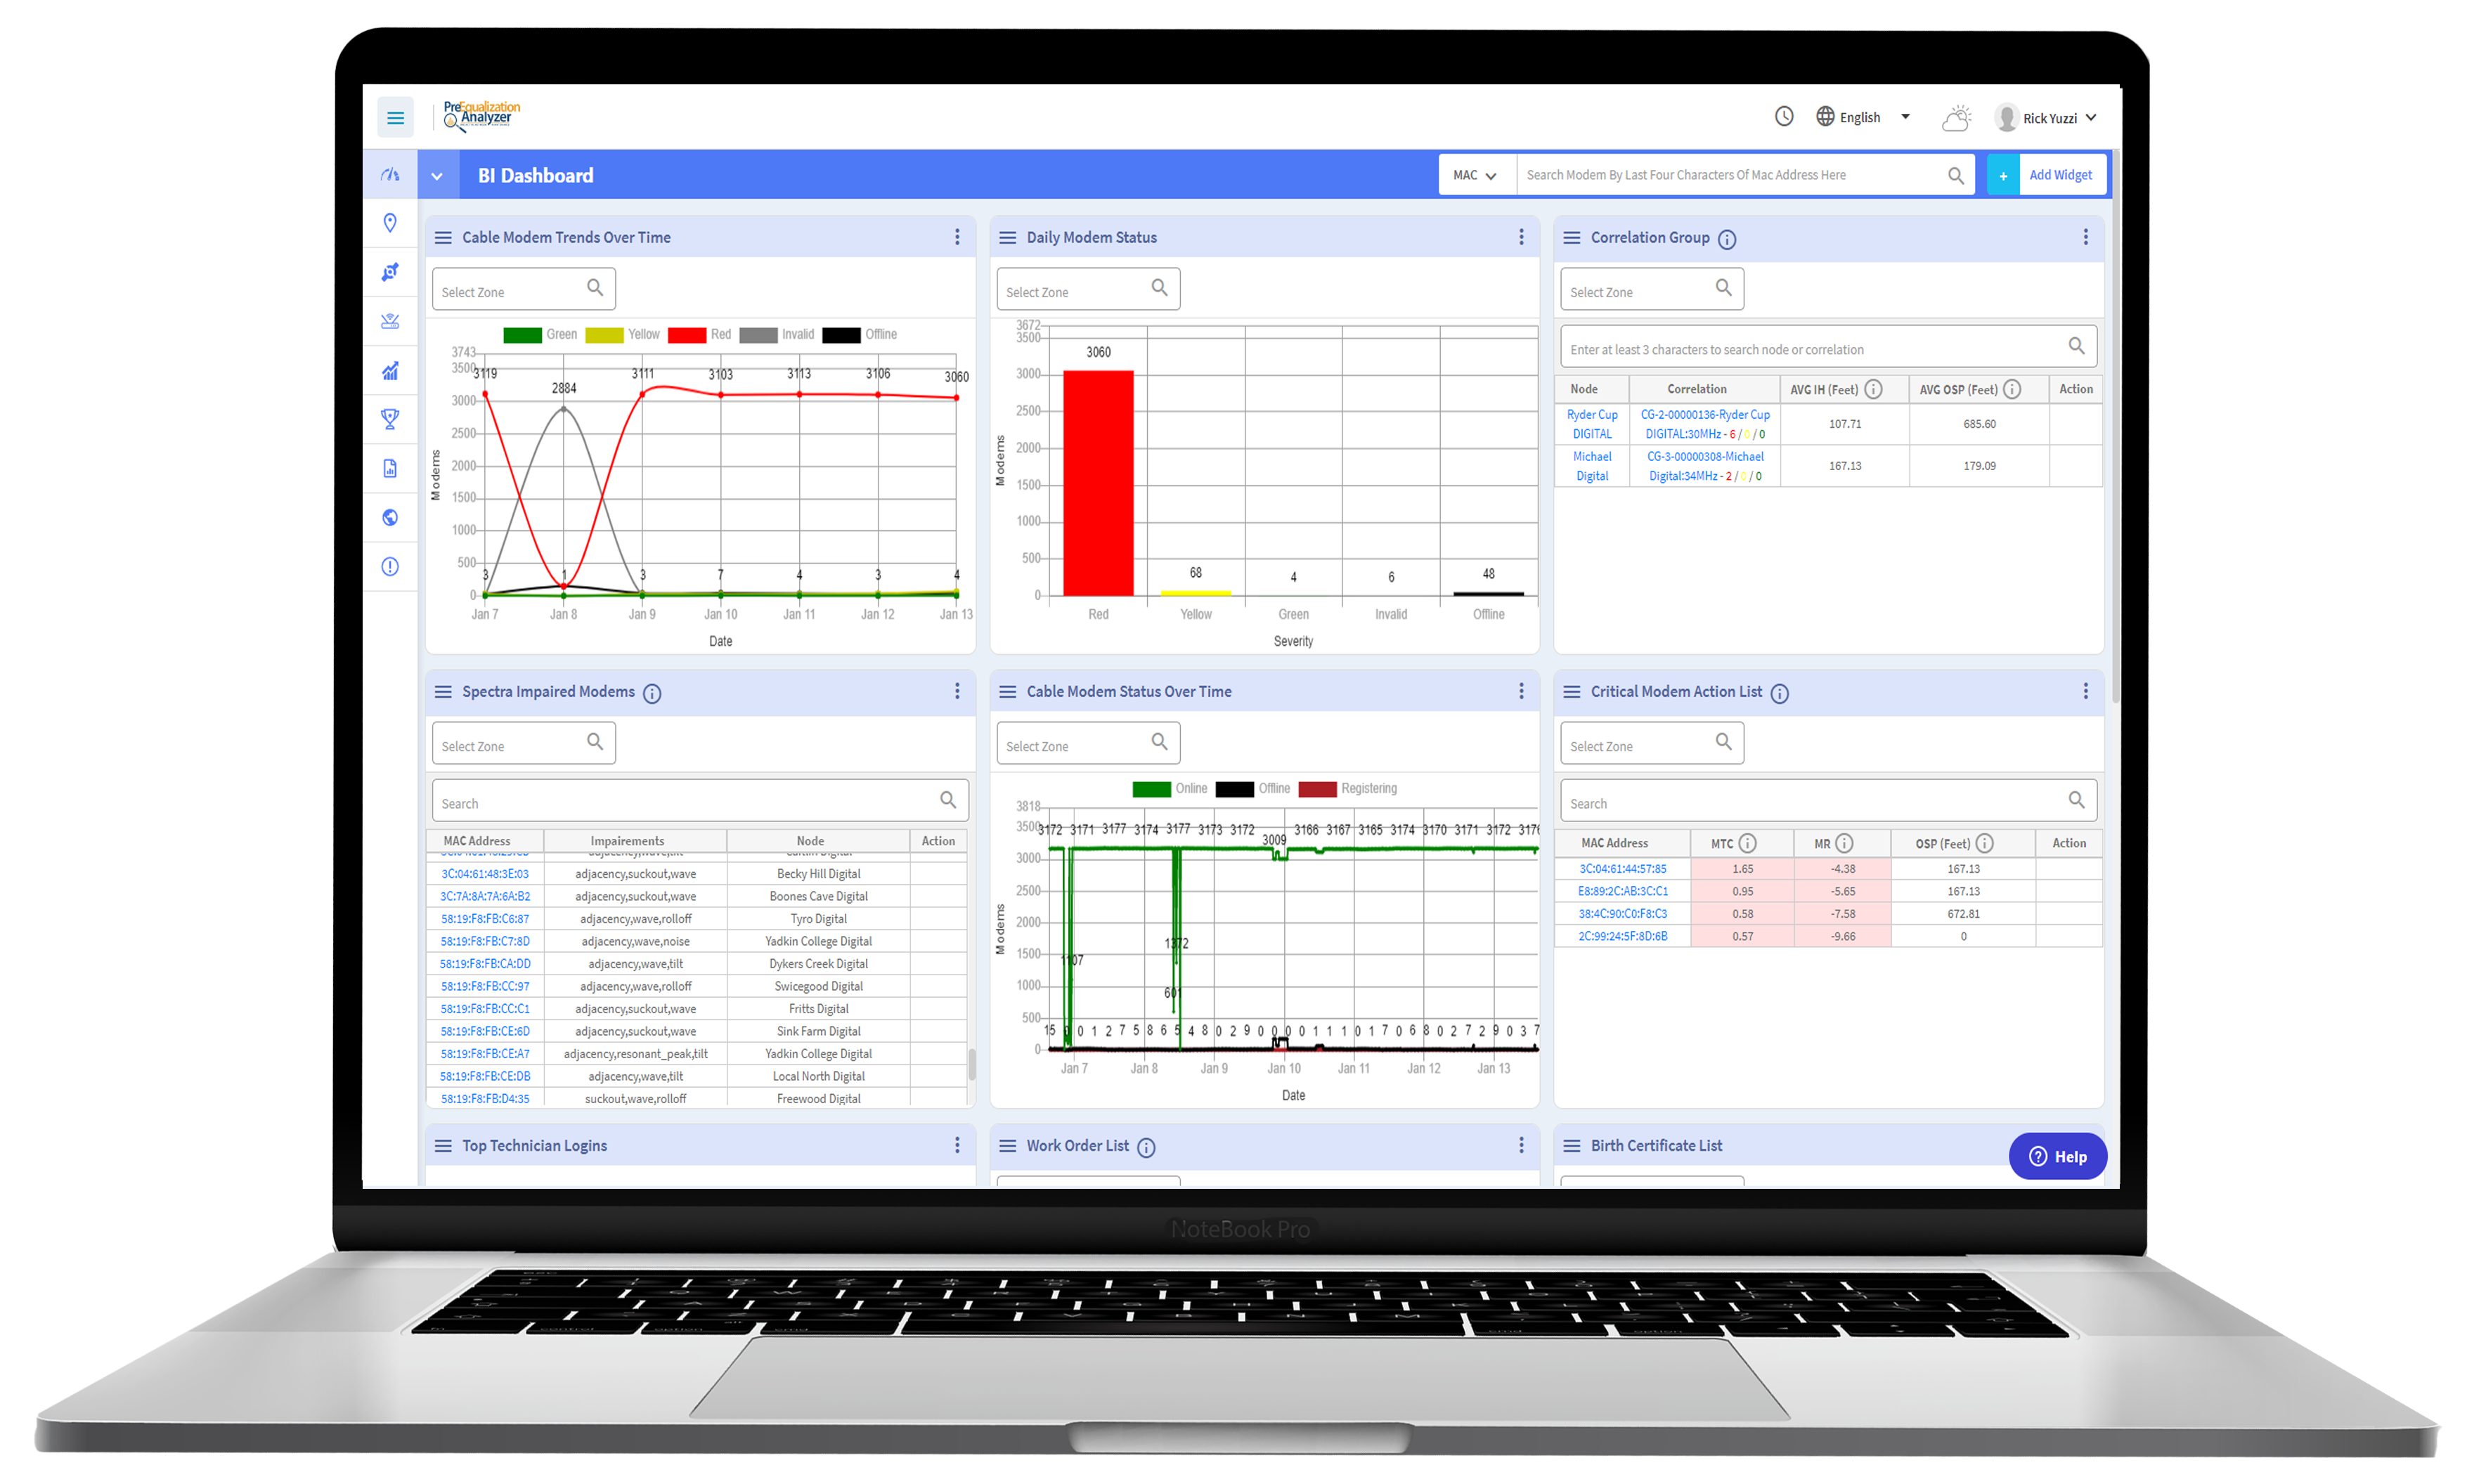
Business Intelligence Dashboard
Interactive Mapping: Detailed View
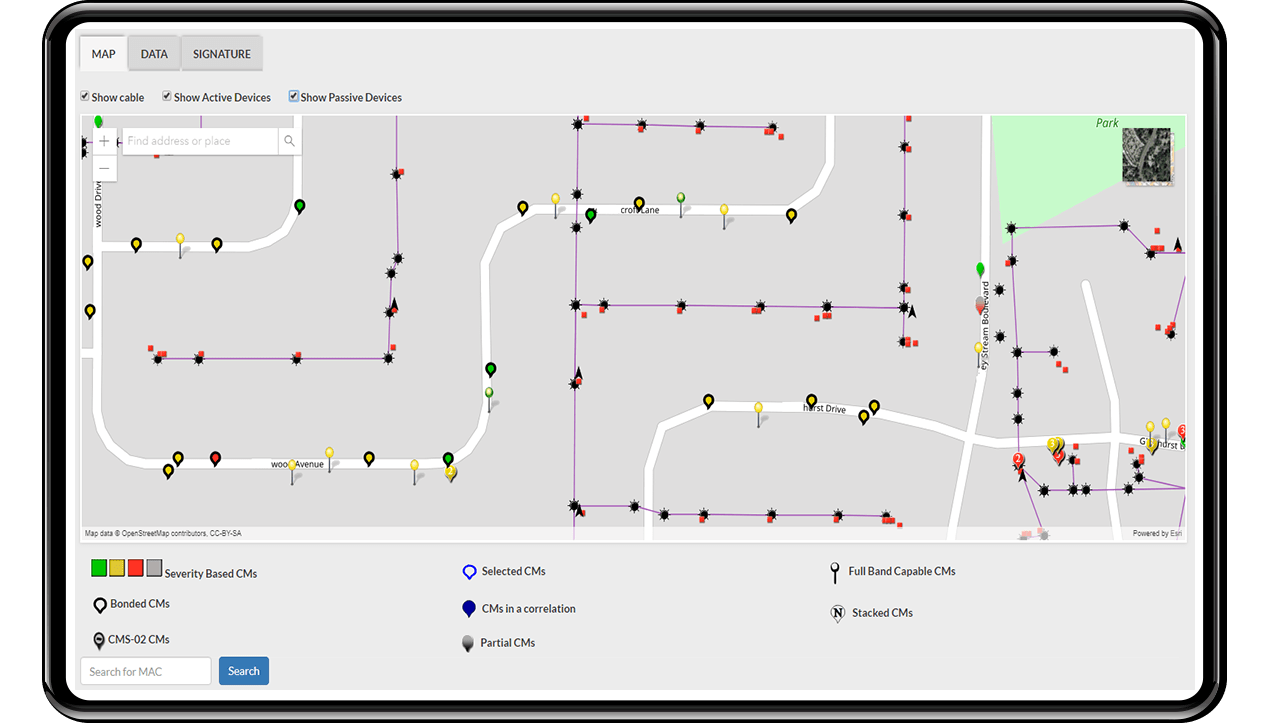
Strand Map Overlay
Geolocation

Ingress Detection
Device Drill-in
When viewing a device in a table or on the map you can drill-in to see more details such as the modem vendor, software version, MAC Address, port, digital tap response, in-channel frequency response, micro reflection levels, group delay, TDR, and VTDR. You can also see if the modem is associated with a correlation group, which is when the application identifies a common impairment affecting multiple modems (see below). In addition, you can view the history of the modem to see past performance.
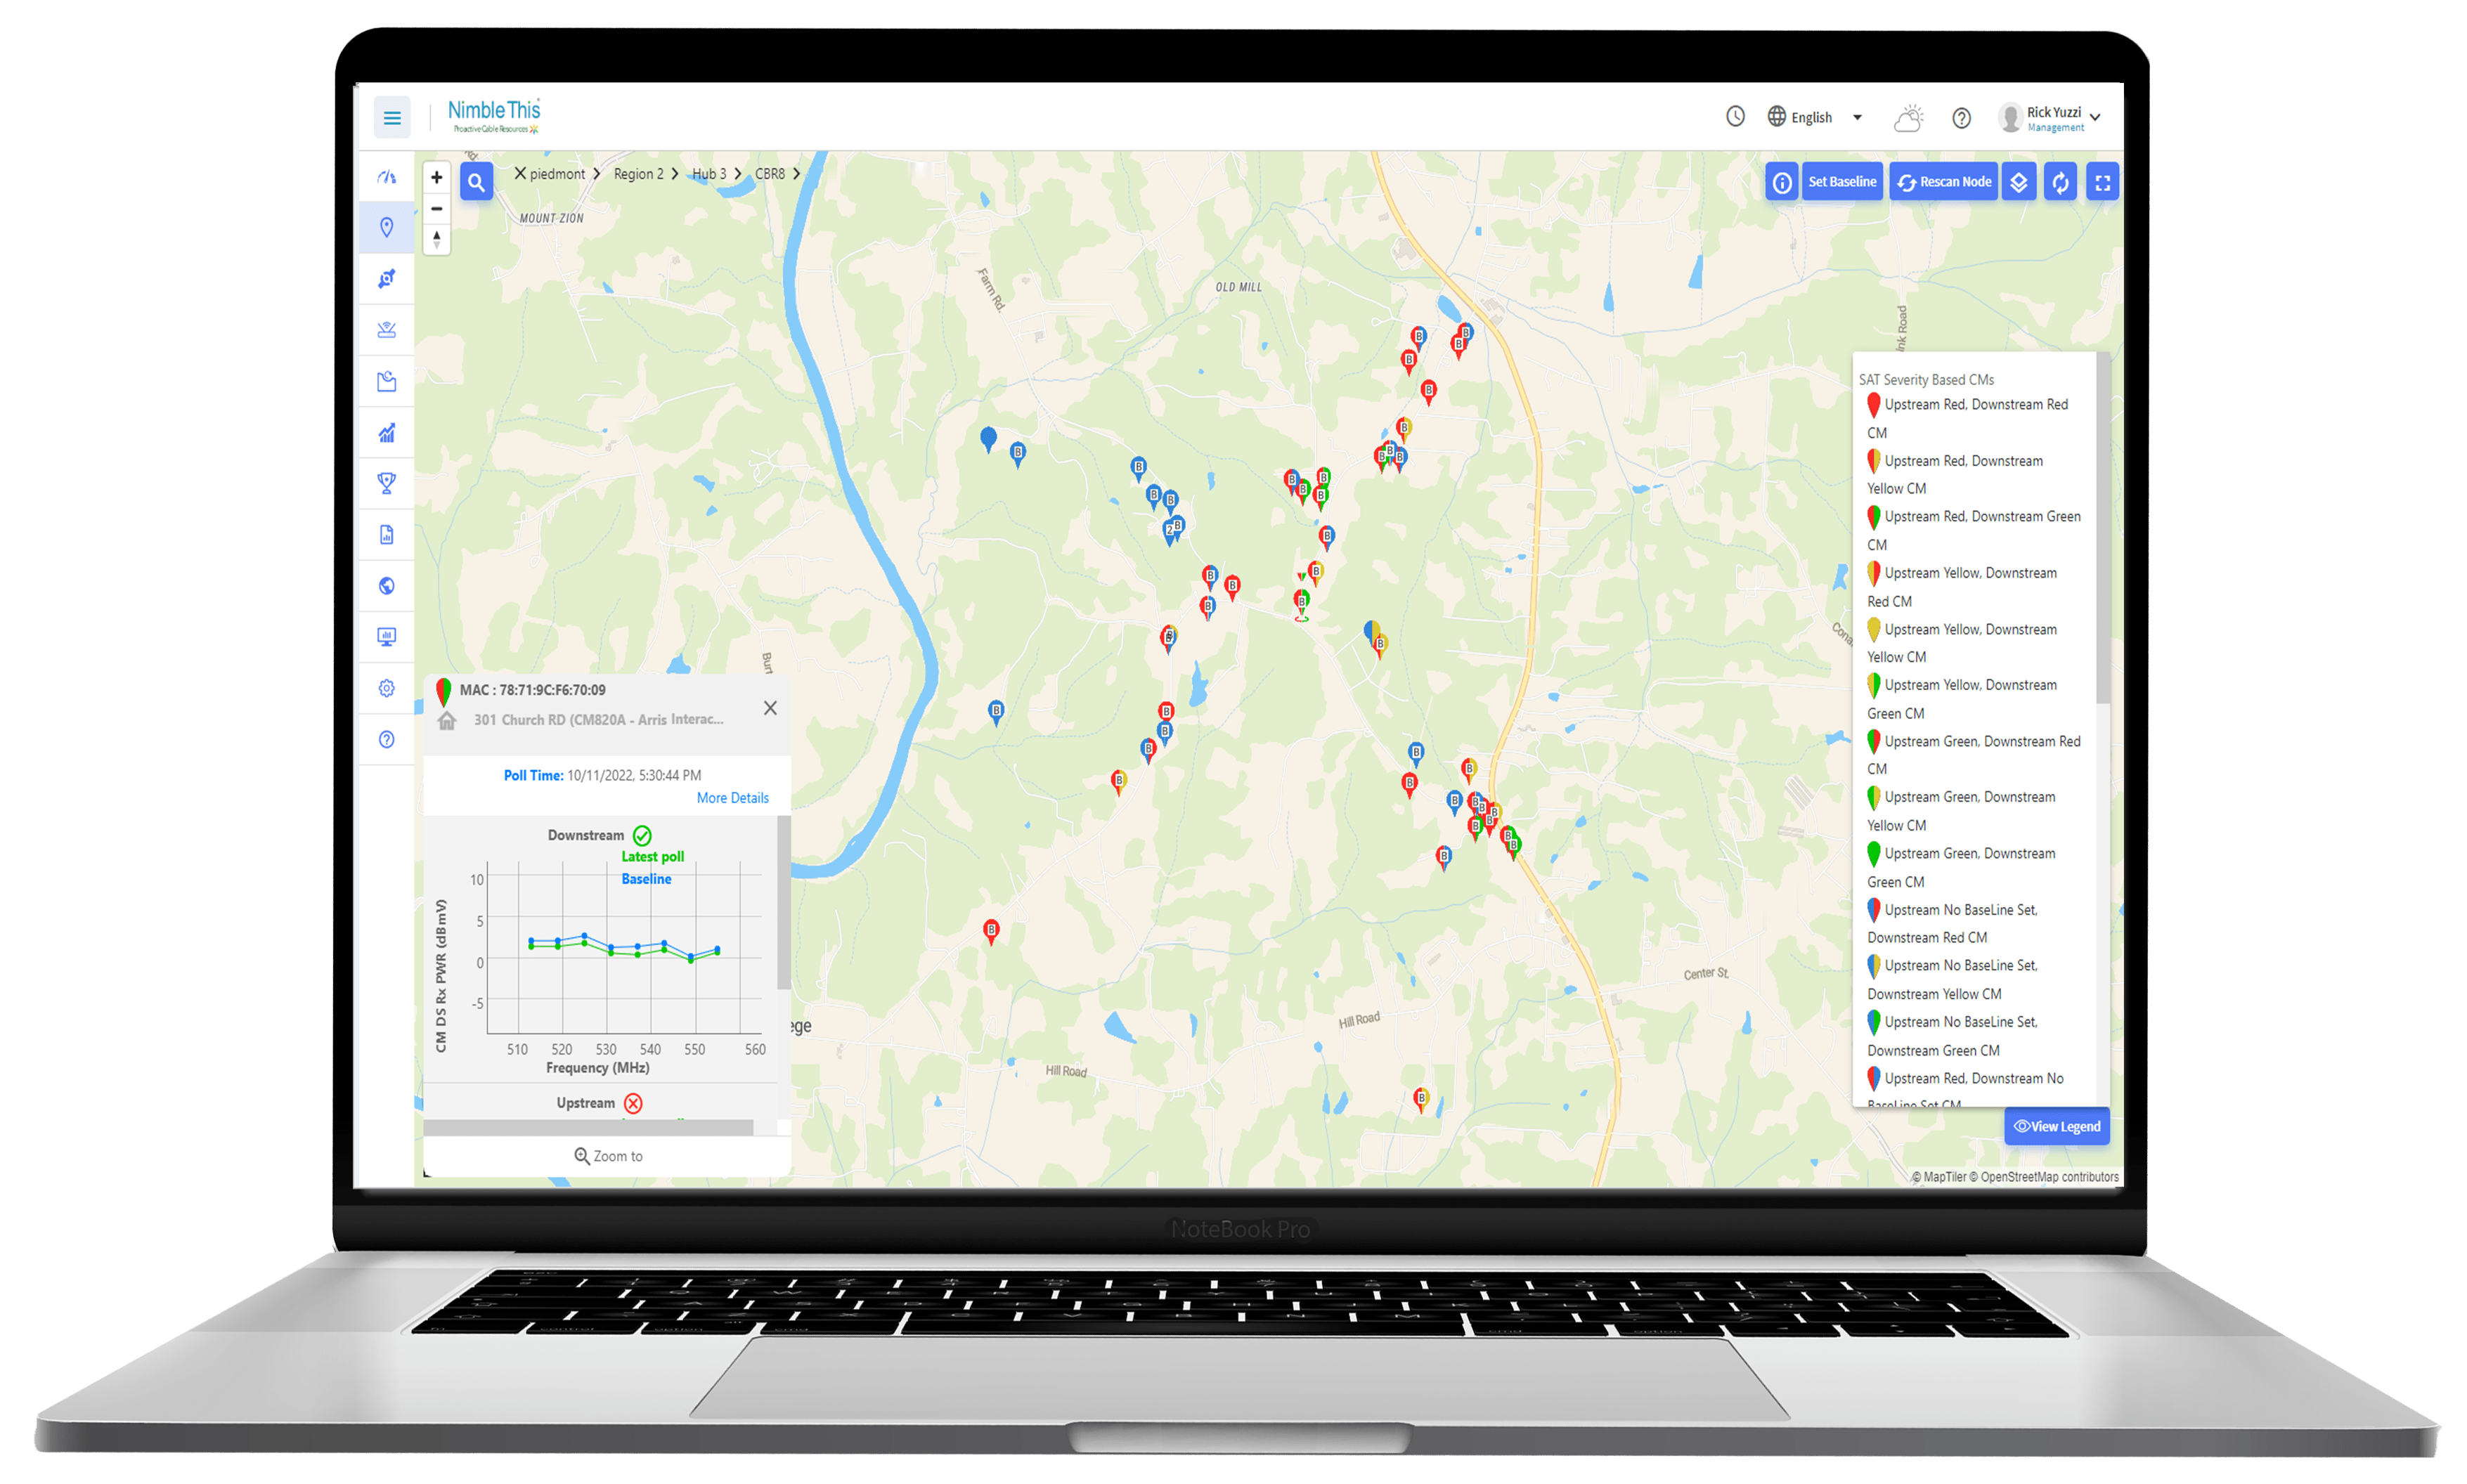
Sweep Analytics Tool
With our Sweep Analytics Tool you can take a baseline snapshot of all of the devices on a node. The baseline is stored for you and acts as a reference point to see changes that take place in the plant over time. At any a time in the future you can initiate a “virtual sweep” with one click, which will compare your baseline with the current readings and display any significant changes that have occurred in the downstream or upstream signal on each device since the baseline was taken. You can also click each pin on the map to see that device’s current response and how it has changed since the baseline was taken. This can reduce or eliminate unnecessary sweeps by giving you a method to track RF changes over time, and directing you to the location in the plant where an issue needs to be addressed.

See Common Upstream Impairments
See Common Downstream Impairments
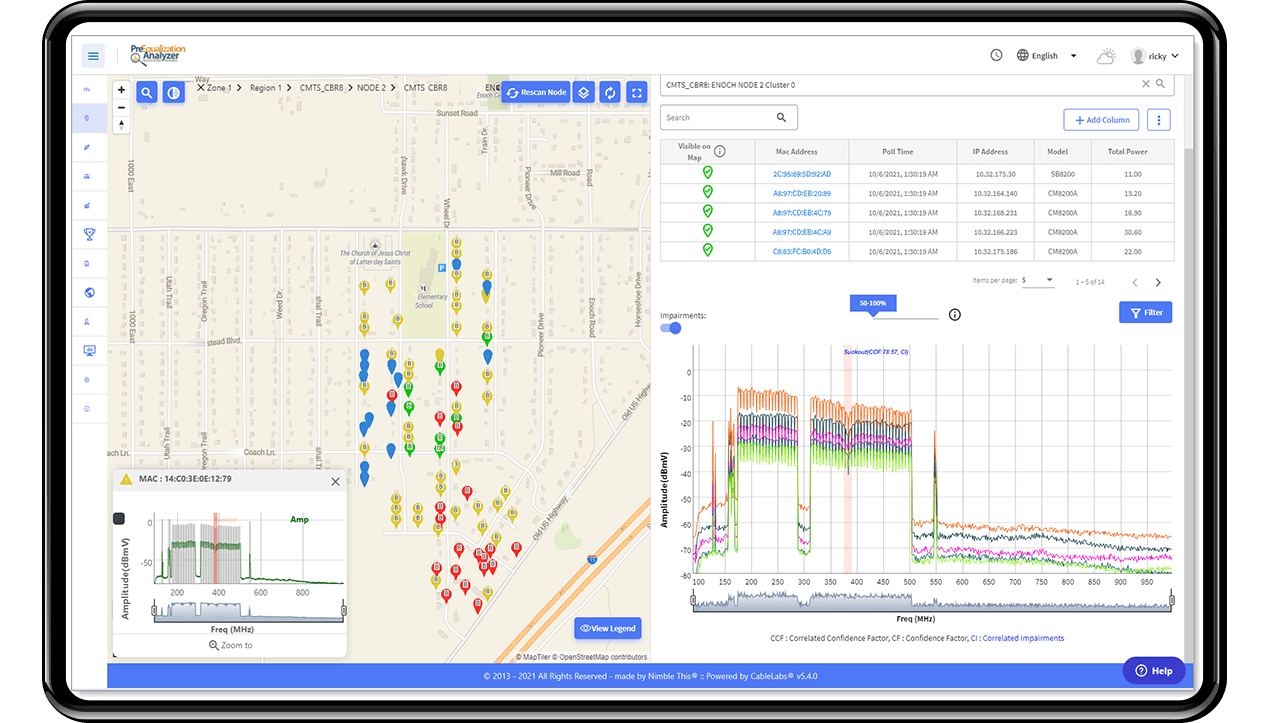
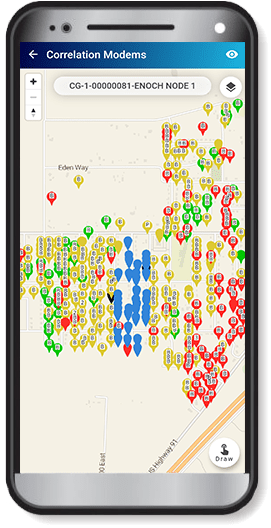
PreEqualization Analyzer also looks at all of your modems that support full-band-capture and correlates clusters of modems that have a similar downstream spectrum response, such as nearby devices experiencing a common suck-out or standing wave. This reduces truck rolls and wasted time in the field by confirming that an issue is in the outside plant, and cannot be resolved at a subscriber’s home. You can also easily click from modem to modem in the correlation group map to compare the downstream spectrum for each device. It’s like doing a virtual sweep right from your PC or phone, no matter where you are.
Full Band Capture Spectrum Analysis
SpectraVizion displays a list of all devices experiencing downstream spectrum issues. You can drill-in to view a capture of the full spectrum from that day for any device that supports spectrum capture. Click again to see captures from previous days. You can also rescan the modem at any time to capture the current spectrum and see if anything has changed.
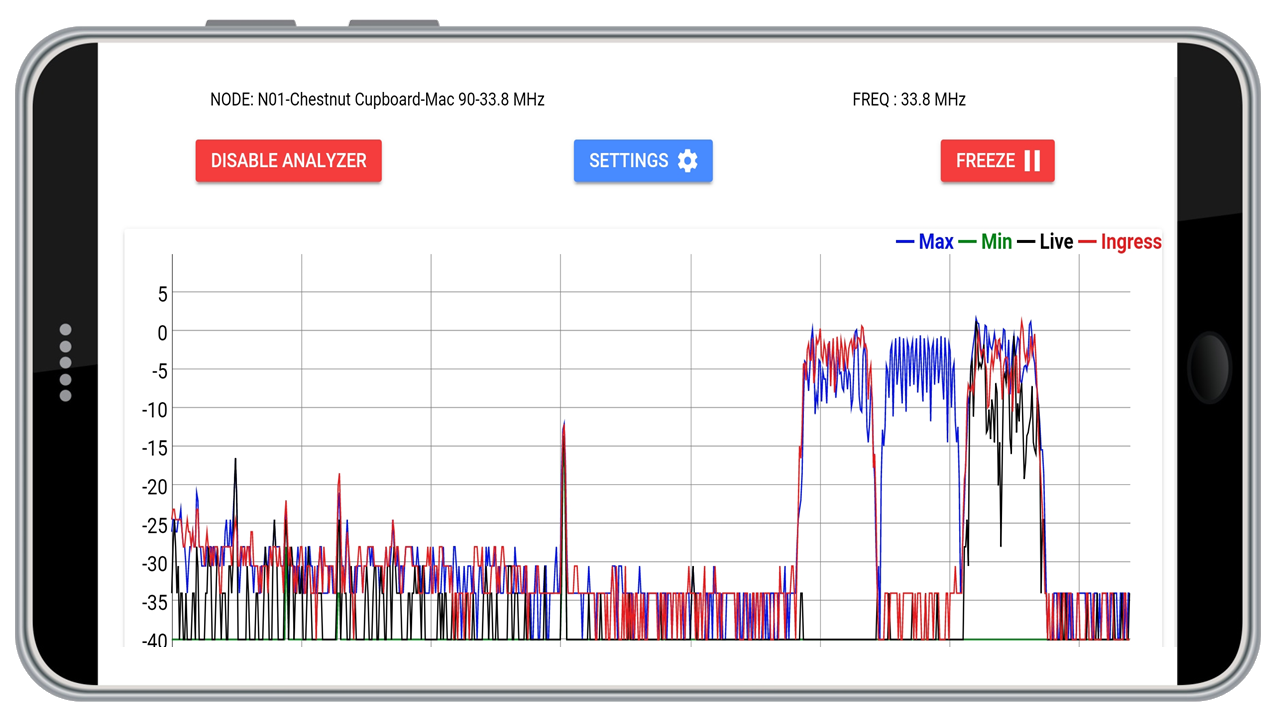
Upstream Spectrum Analysis
Our Upstream Analyzer displays the upstream spectrum from your CMTS in real time from anywhere. You can view the live spectrum passing through the CMTS on a PC or mobile device. There are settings for Live. Max Hold and Min Hold, and with one click you can view ingress under the cable modem. You can also view a history of the upstream spectrum over time. Best of all, there’s no expensive equipment or complicated cabling to set-up. All you need is your CMTS.
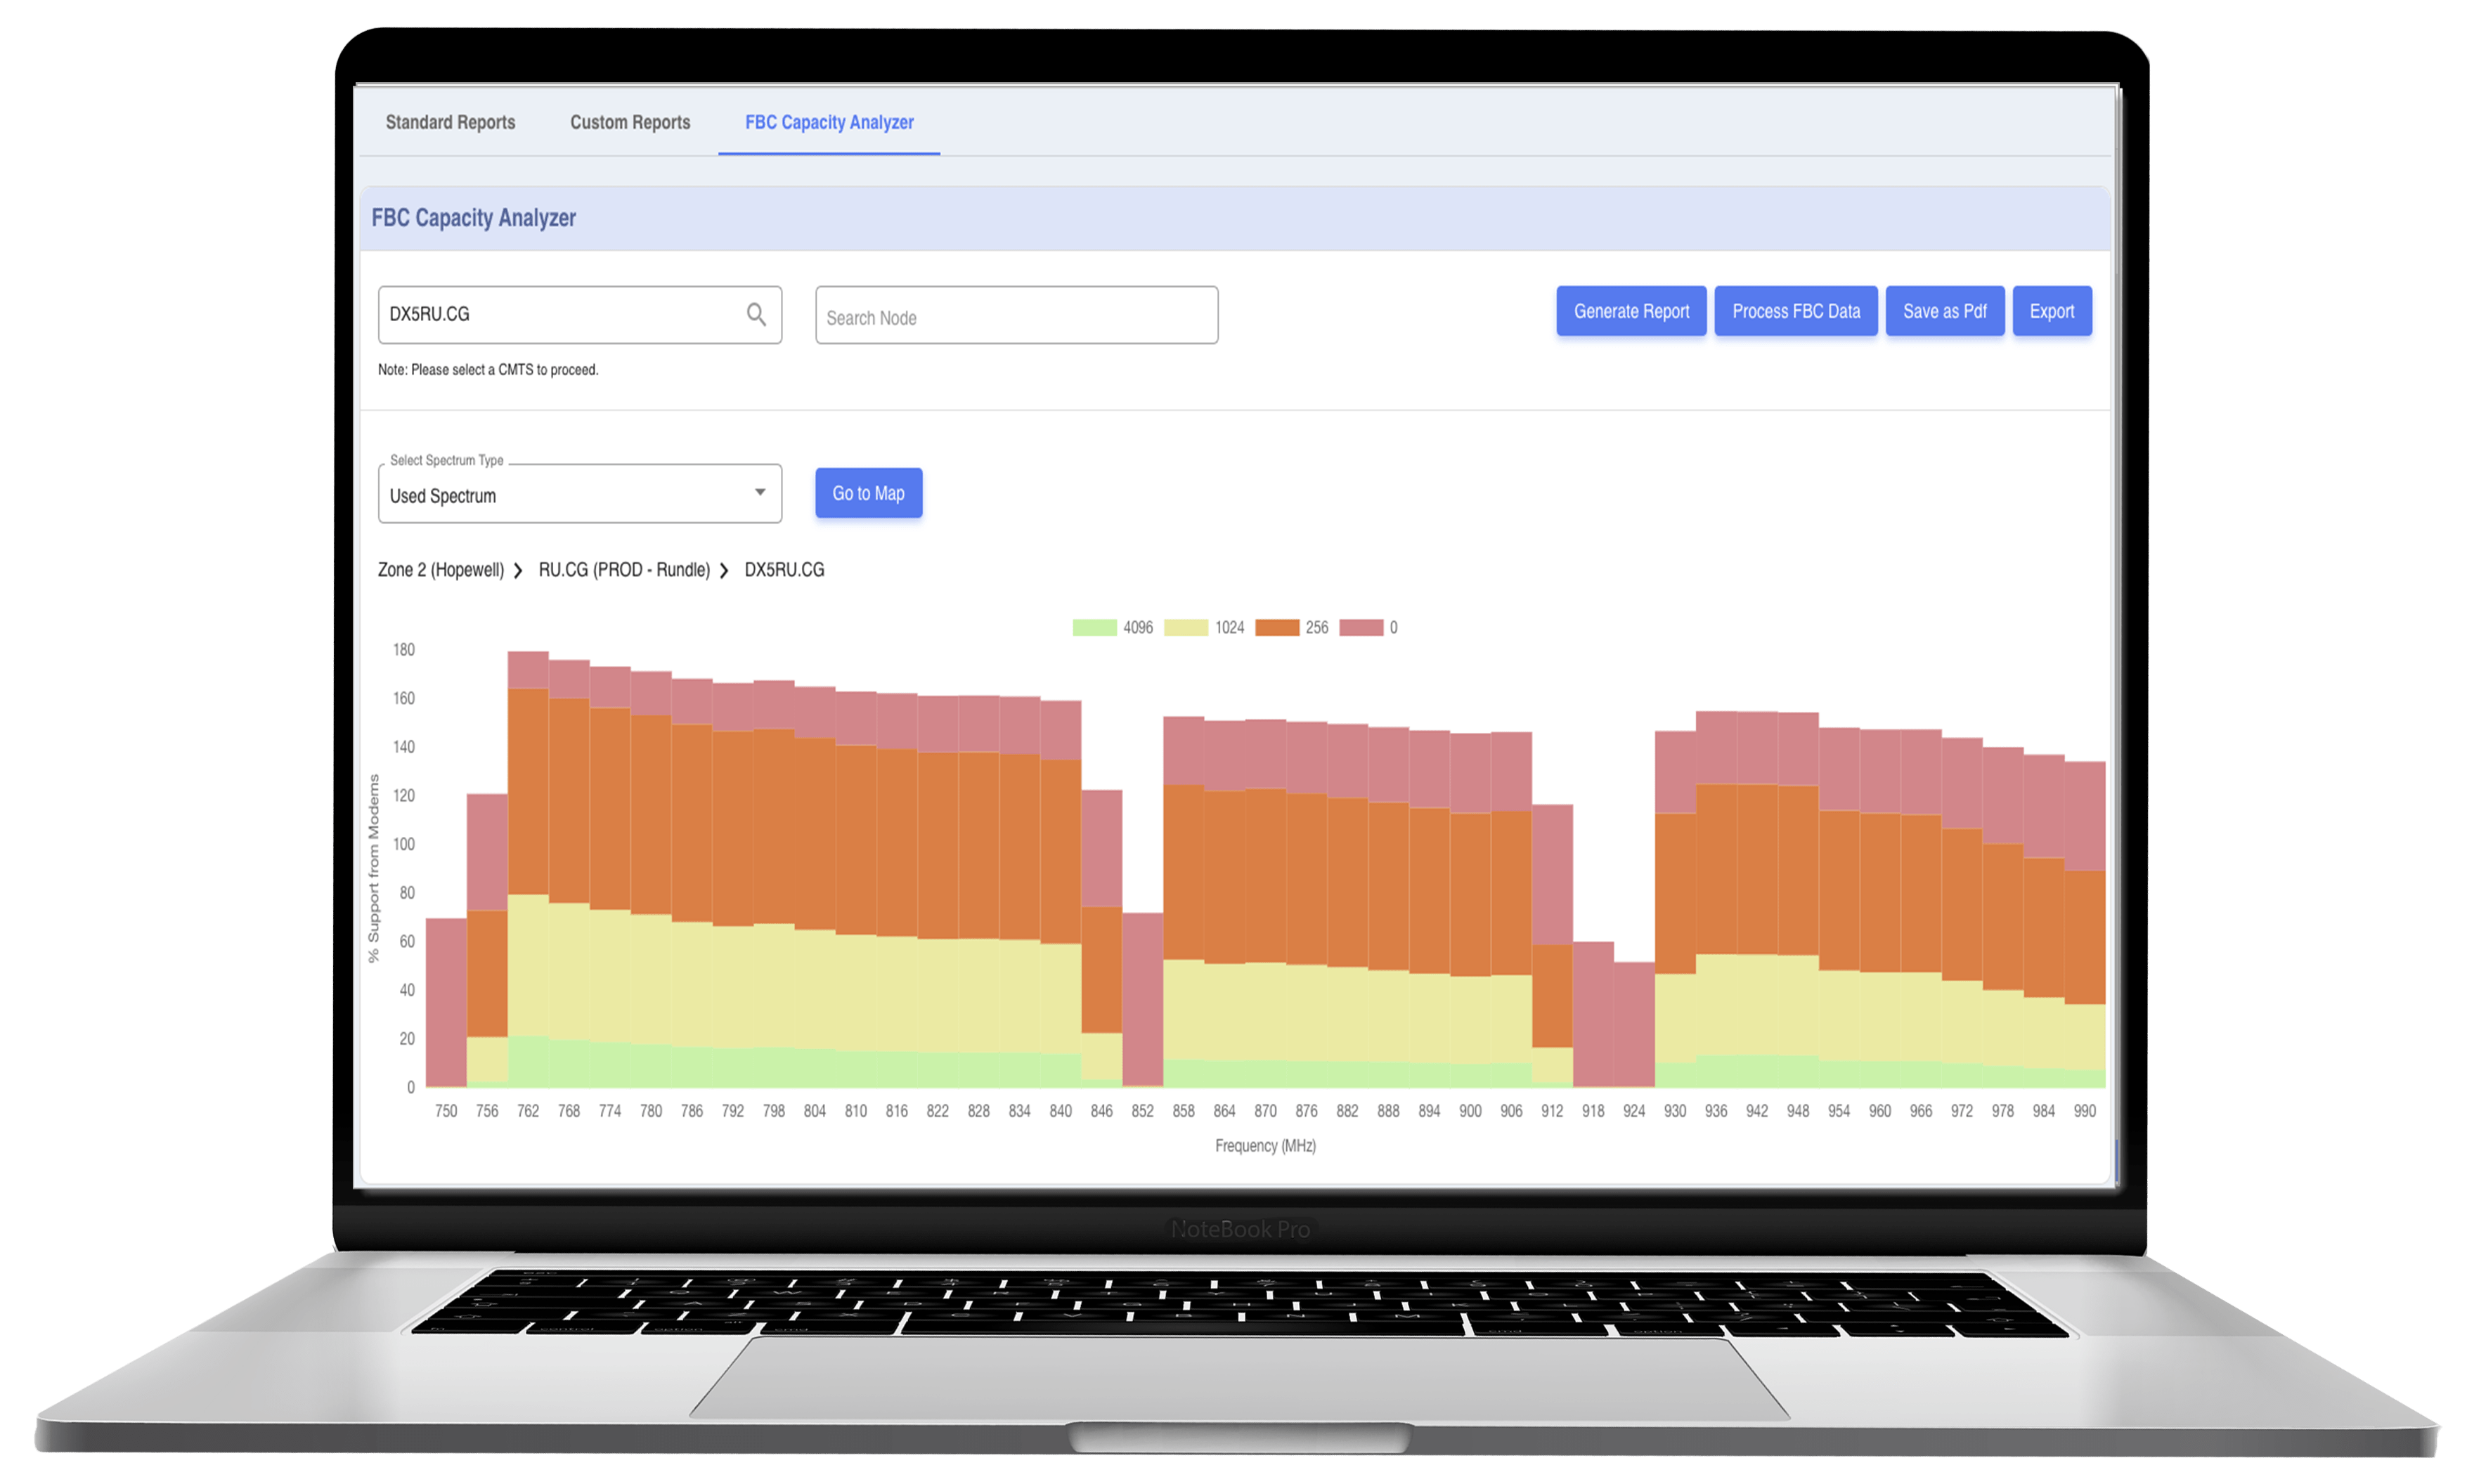
DOCSIS 3.1 OFDM Capacity Planning
PreEqualization Analyzer can also help you determine which parts of your HFC plant can support OFDM channels even before they are deployed and the order of modulation that could be attained. In essence, you are prequalifying your plant by determining what sections of the plant are ready for immediate DOCSIS 3.1 deployment and what sections will need improvement first. This is done by leveraging full band capture data from your existing DOCSIS 3.0 and 3.1 modems. You can also display on the map what subscriber devices can immediately support a given OFDM modulation level based on estimated RF performance. These features will allow you to plan for DOCSIS 3.1 more efficiently by giving you a better idea of the level of effort and plant upgrades that will be needed in order to deploy OFDM.
Profile Management Application (PMA)
Our PMA solution is a network-deployable tool that you can integrate and use within your DOCSIS 3.1 network. It takes the data generated by the network devices and creates a set of optimized OFDM and OFDMA profiles, taking into account various capabilities supported across your CMTS platforms. Rather than limiting the profiles to the best modulation that all cable modems and CMTS can use because of impairments on certain parts of the network, PMA lets you determine the best possible modulation for every frequency on every channel.
Cable Modem Installer and Birth Certificates

With our Cable Modem Installer and Birth Certificate feature, your installer can make sure the cable modem meets your criteria before leaving the subscriber’s home—and you have a permanent history of that install. When your technician runs the Cable Modem Installer it automatically checks key upstream, downstream and PNM readings. The test clearly shows where a device passes or fails so that any issues can be addressed by the technician before they leave the home; or, if need be, handed off to another technician if the problem is further out in the plant. That definitely beats having to roll a truck a week later to a newly dissatisfied customer.
The Cable Modem Installer can be run multiple times from any location. Each time it is run it generates a Birth Certificate, which includes the last test results and readings, the tech’s name and a timestamp. This provides you with a record of each installation attempt, allowing you to track overall installation success. This also keeps your installers accountable, including any contractors you may employ, and it can show you where there may be a need for additional training.
Integrated Work Orders
If you see an outage or an opportunity to do some proactive maintenance, you can send a work order to the nearest available technician, which is pushed to their mobile device. Through the app they can log all work performed – making notes, adding pictures if needed, and closing it out. You can check the status of the work order at any time so you have up-to-the-minute information on what has been completed and which technicians are available.
PNM Mobile App
The Nimble PNM Mobile app was created specifically to sync with the PreEqualization Analyzer desktop application. Download and install the app on your mobile device and get fast and easy access to PreEqualization Analyzer from the field. You can manage your proactive network maintenance activities directly from the app anywhere and anytime. At the touch of the screen, you’ll have access to key PreEqualization Analyzer features including device screens, correlation groups, Cable Modem Installer, Work Orders, SpectraVizion downstream spectrum capture, and Upstream Analyzer (licensed separately). Nimble PNM is available for both Android and iOS devices on Google Play and the App Store.