TruVizion Fiber: Features
TruVizion’s OLT Diagnostics screen aggregates and displays information from the ONTs on the network. You can quickly see which PON ports have the most devices experiencing upstream and downstream issues, the status of each PON, upstream and downstream bandwidth utilization, online ONT status, and alarms on each port. Color-coded bars show the highest priority issues regarding performance, bandwidth utilization, and DS and US port statistics. You can pinpoint trouble areas by drilling in to view a report on all devices experiencing similar issues, and you can view real-time and historical data to look for trends. Reports can be saved or printed, and you can even map all of the devices shown on a report with a single click.
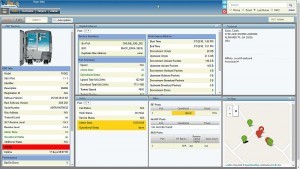
The ONT Diagnostics Screen is perfect for your Call Center staff and others in your organization who are troubleshooting individual subscriber issues. You can query a subscriber directly by their contact information or device information and see diagnostic data about their device, its transmit and receive levels, alarms, errors, and uptime. View detailed stats on all your data ports and drill in to plot historical performance metrics over time, from 24 hours to 90 days. In addition, you can view the status of any provisioned Voice and Video ports and services. A map on the screen shows you where the subscriber is located and nearby devices, and pins are color-coded to indicate any alert levels. You can even access the device’s management interface on compatible CPE.
In addition to real-time metrics, TruVizion allows you to see interactive charts that show key OLT and ONT metrics over the last 24 hours, 7 days, 30 days or 90 days. One click shows you historical information for any PON port, including aggregated ONT status over the selected time period (transmit and receive power, and any data video or voice errors), online/offline counts, upstream and downstream bandwidth usage, transmit power, laser temperature, and errors (BIP, GEM and Burst). On the ONT screen you can drill in to see historical charts for that device, including transmit and receive levels, the receive level at the OLT, and any errors (BIP, GEM and Burst).
Bandwidth Utilization by PON/fusion_title]
The OLT screen shows you a chart of the downstream and upstream bandwidth use by PON port, sorted by most to least. Color-coded bars quickly let you know if you have reached a bandwidth threshold. And, if you click on any bar in the chart, we generate an on screen report of all of the subscribers making up that bandwidth use for that PON port. You will see current bandwidth use, and with one click can choose to see usage over the last seven days and the seven days prior to that; or, the last thirty days and the thirty days prior to that.
PON Status, Transmit Level and Laser Temperature/fusion_title]
On the OLT screen you can see the status of each PON port, the transmit level, and the temperature of the laser in the SFP. Drill in to see these stats over time to track trends.
WiFi Diagnostics Data
Over half of the complaints that subscribers call you for relate to their home WiFi network. For compatible GPON devices we can link your service rep right to the device in the home so they can remotely manage the ONT just as if they were in the home connected to the ONT’s GUI. This helps determine if a problem is related to the fiber connection or the in-home network, which can eliminate the need for a truck roll. It can also reduce talk time in the Call Center because Call Center representatives won’t need to walk the subscriber through the process of accessing the device’s management GUI in order to access troubleshooting data or changing settings.
VoIP and Video Diagnostics
TruVizion makes it easier to support your VoIP customers. For ONTs you can see call status, hook status, outbound and inbound call attempts and completions, and more. You can also view details on your provisioned video ports, including alerts for video port outages, and optical signal issues on the return path.
Often times a map in a diagnostics application is eye candy. It’s kind of colorful and cool-looking, but it’s just not that useful. In TruVizion the maps not only look sweet, they are sweet. Your staff can actually use them to quickly find and diagnose customer-affecting issues. Sure, they’re colorful. Green is good, and you’ll immediately see those devices that are performing within spec. Yellow tells you a device is marginal, and red says something’s really wrong. Best of all, you can filter the map by status or alerts and view where the subscriber is located and nearby devices. Want to see on the map only those devices that are offline, no problem.
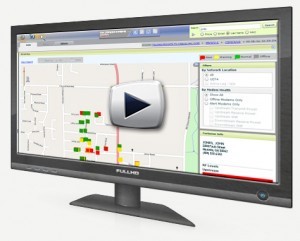
Watch this video to learn more about this feature!
Sometimes customer addresses on a map are not where they are supposed to be, or may not be there at all if they cannot be geocoded automatically or are geocoded incorrectly. In TruVizion you can easily geocode a device in our system or correct a location if it’s not right. You can add a pin or change the location of a pin on our map with a few clicks. If you at the customer’s location it’s even easier. Just click or tap to geocode the device and the application will place it on the map right where you are.
TruVizion can process alerts that let you know when certain issues or events occur, like a sudden increase in off-line devices or when a threshold is exceeded for a specific metric.
TruVizion has several reports that will help you better manage your network and business. Here are some of the reports included in TruVizion:
- ONT Statistics Report — Run a report showing the status of each ONT connected to a specific OLT, Vendor and Model of the ONT, the port each is connected to, and any data, video or voice errors.
- ONT Performance Report — See each ONT with vendor, model and errors (BIP, GEM and Burst).
- Non-Geocoded Devices — You can run a report showing all ONTs that are not geocoded in the system. TruVizion makes it easy to add pins to the map for any modems that are not geocoded, or to correct the location if a device was automatically geocoded incorrectly.
- Bandwidth Reports — Run reports showing upstream and downstream bandwidth utilization for cable modems and ONTs over a selected date range.


